
To understand the need for DFE it is important to understand how filters are currently tested and validated. Manufacturers use the industry-standard ISO16889 multi-pass test to rate filter efficiency and dirt holding capacity of filter elements under ideal lab conditions.
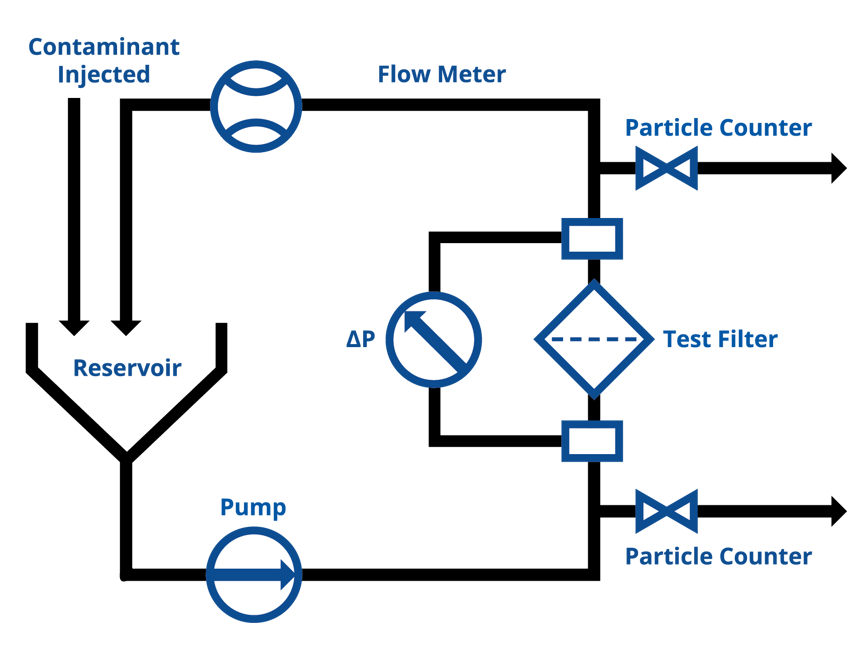
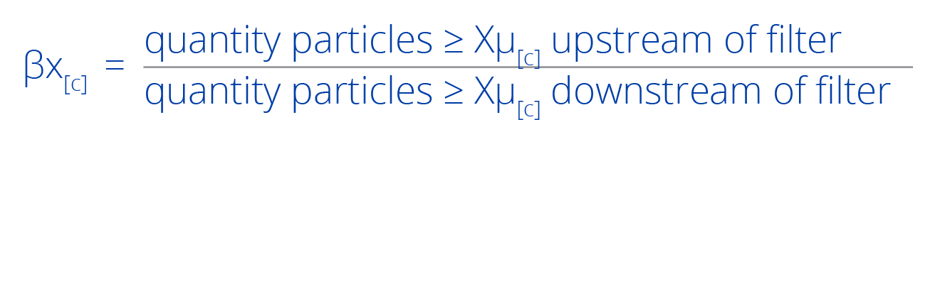
Figure 1 depicts the test circuit where hydraulic fluid is circulated at a constant flow rate in a closed-loop system with online particle counters before and after the test filter. Contaminated fluid is added to the system at a constant rate. Small amounts of fluid are removed before and after the filter, for particle counting to calculate the filter efficiency (capture). The capture efficiency is expressed as the Filtration Ratio (Beta) which is the relationship between the number of particles greater than and equal to a specified size (Xμ[c]) counted before and after the filter. In real-world terms, this test is the equivalent of testing a filter in an off-line kidney loop rather than replicating an actual hydraulic or lube system. It’s basically a filter cart test.
EXAMPLE: |
Β7[C] = 600/4 |
FILTRATION RATIO (BETA): |
Β7[C] = 150 |
|
|
In the example, 600 particles greater than or equal to 7μ[c] were counted upstream of the filter and 4 were counted downstream. This Filtration Ratio is expressed as “Beta 7[c] = 150”. The [c] is referred to as “sub c”. The sub c is used to differentiate between multi-pass tests run per the current ISO16889 multi-pass test with new particle counter calibration per ISO11171 from ISO4572. Filtration Ratio expressed or written without the “sub c” refers to the antiquated ISO4572 multi-pass test superseded by ISO16889. The efficiency may also be expressed as a percentage by converting the Filtration Ratio:

Example: |
Efficiency % of β7[c]=150 (150-1)/150 x 100 |
Efficiency %: |
99.33% |
Using our Beta Ratio found in the first example, we can calculate that the test filter is 99.33% efficient at capturing particles 7μ[c] and larger.
Filters for critical hydraulic, lube, and fuel systems are specifically designed for high-efficiency particle capture. However, a filter is not a black hole, capturing and retaining particles in a real-world dynamic environment is far more challenging. Hy-Pro pioneered the DFE (Dynamic Filter Efficiency) multipass test to optimize performance under real-world conditions. This methodology drives the development of proprietary media layers, media support structure, and filter construction. The results are higher efficiency particle capture and retention and cleaner fluids when Hy-Pro upgrade elements are in service.
Hy-Pro uses DFE and the ISO/CD23369 Cyclic Flow Multi-Pass Test to benchmark performance between its filters and those of its competitors. The Cyclic Flow Multi-Pass protocol ISO/CD23369 moves the industry-standard one step closer to real-world conditions by incorporating cyclic flow with rapid flow transitions (between 100-200 msec) as shown in Figure 2.
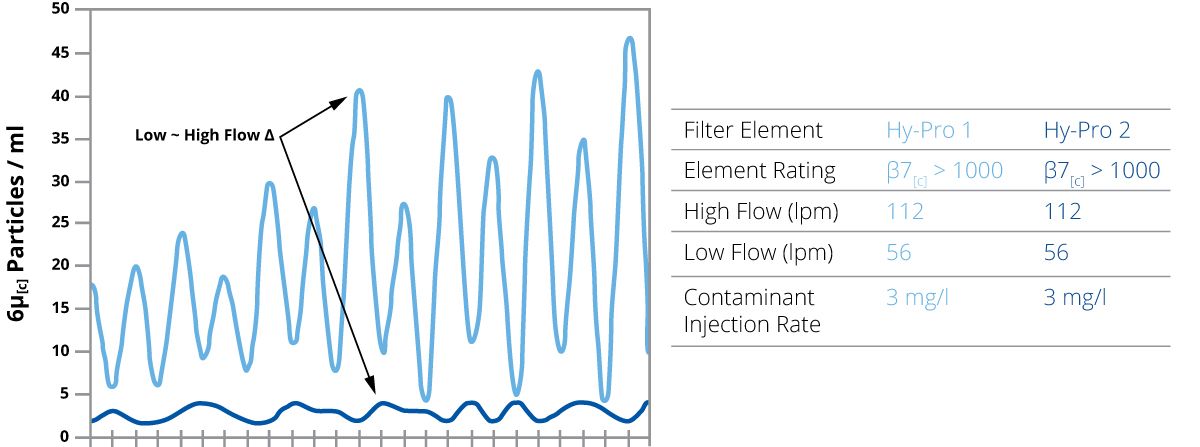
Figure 2: Particle Counts Downstream of Filter 6µ[c]
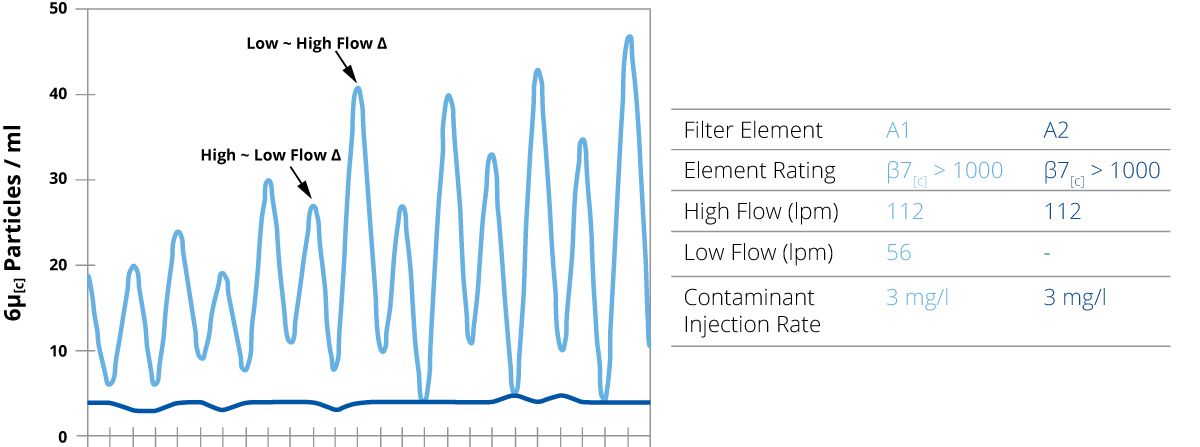
- Figure 2 compares the performance of two identical high efficiency glass media filter elements, one tested to ISO16889 multi-pass and the other to the DFE multi-pass method. The graph expresses the actual number of particles 6μ[c] and larger counted downstream of the filter element from several data points during the tests.
Filter A2 was tested at a constant flow rate and maintained a steady efficiency throughout the test. Filter A1 was cycled between max rated flow rate and half of rated flow with a duty cycle consistent with that of a hydraulic system. The downstream counts for Filter A1 varied and were highest during changes from low flow to high flow. The peaks represent counts taken during flow change and the valleys represent counts taken after each flow change. The alternating high peaks represent counts taken during changes from low flow to high flow. As the amount of contaminant captured by Filter A1 increased, the downstream counts increased most dramatically during the flow changes from low to high. Filter element A1, not properly designed to retain previously captured contaminant during dynamic system conditions, can become a dangerous source of contamination as it captures and then releases concentrated clouds of contaminated fluid.
Figure 3 shows the particle counter raw data (top- upstream, bottom-downstream) for Element A1 before a change from low flow to high flow and Figure 4 shows the particle counter data for Element A1 during a change from low flow to high flow. The downstream particle count trace during the change reveals a much higher quantity of smaller particles and larger particles that did not pass the element before the dynamic system condition. This phenomenon can best be described as “contaminant unloading”. As the filter element captures more dirt, greater amounts may be released back into the system that it is installed to protect when the element is subjected to a dynamic flow condition and change in differential pressure across the element. Unloading may also occur when the flow rate changes from high flow to low flow, represented by the alternating smaller peaks in Figure 3. The filter element typically recovers shortly after the dynamic condition, but highly contaminated clouds of fluid from contaminant unloading can cause severe component damage and unreliable system performance. -
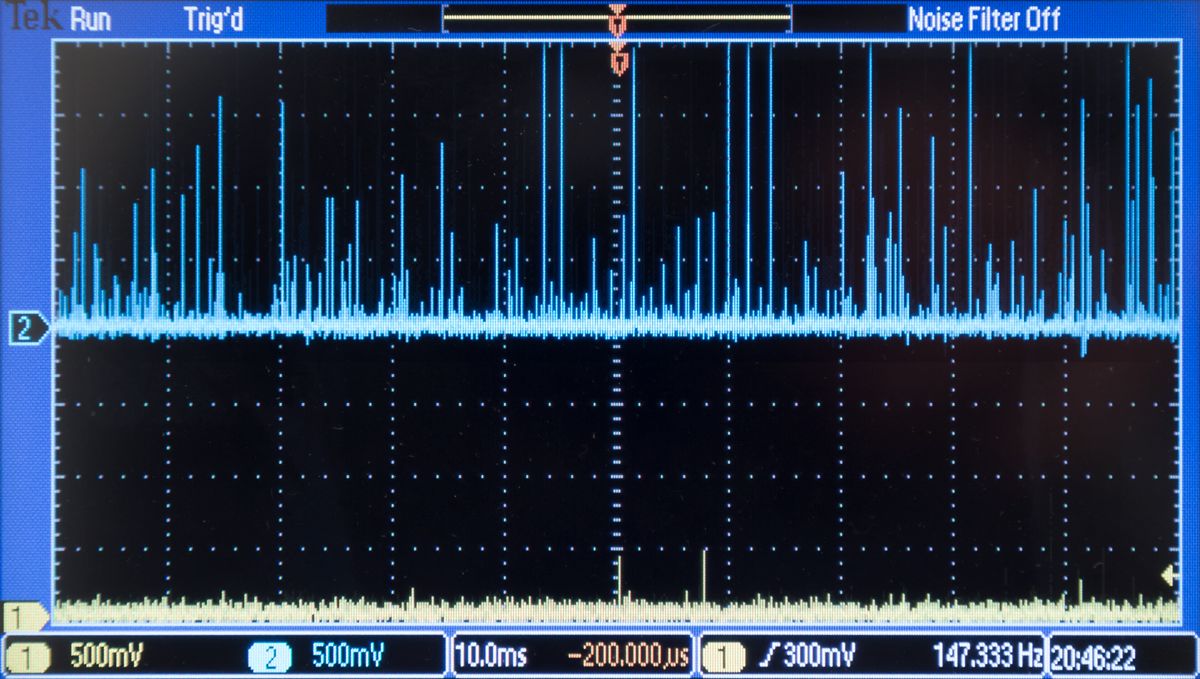
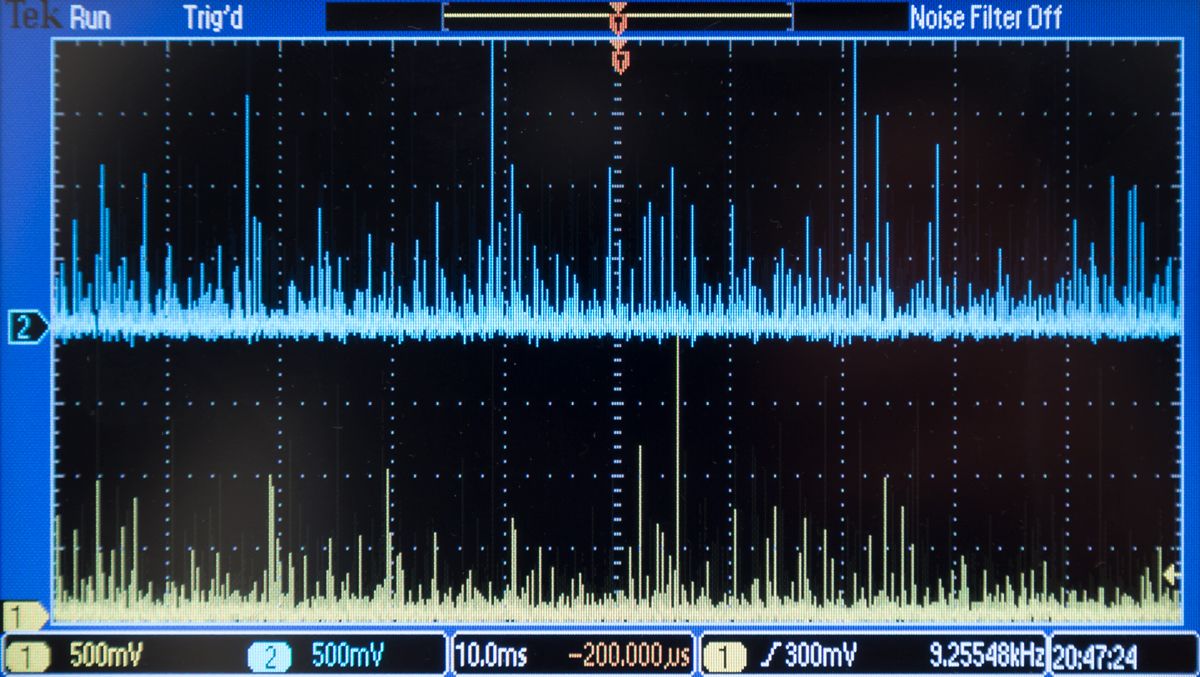
Figure 5 compares the performance of two identical Hy-Pro filter elements designed and developed per the DFE multi-pass test method. All Hy-Pro elements that utilize the G8 or higher media carry the Hy-Pro DFE rating.
Although the contaminant unloading effect is still evident, the unloading is insignificant as filter element Hy-Pro 1, tested per DFE, performed true to its ISO16889 multi-pass rating of β7[c] > 1000 even during dynamic flow conditions.
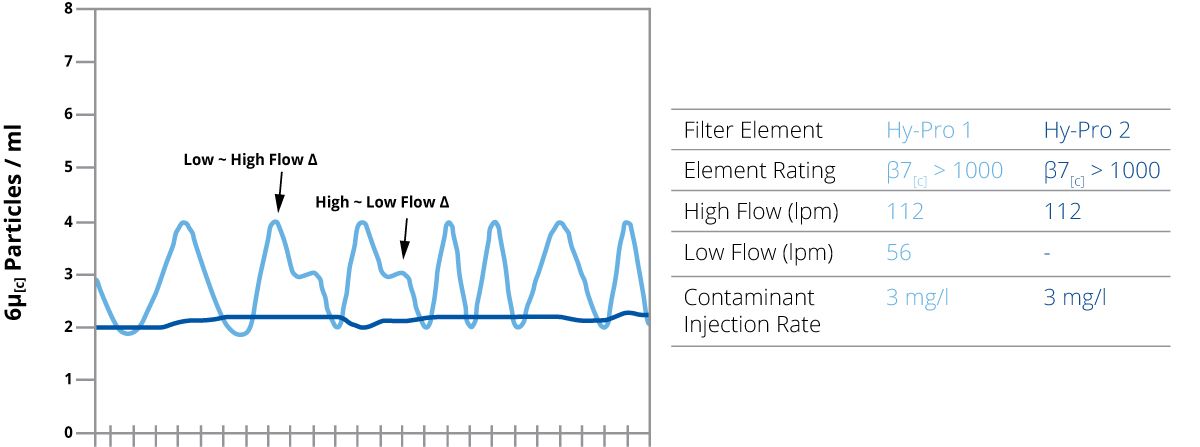
Figure 6 compares the performance of filter Element A1 and Hy-Pro 1 (DFE rated). Both elements demonstrated excellent particle capture performance during the ISO16889 and DFE testing. The DFE rated Hy-Pro element yielded much more stable particle counts downstream of the element and more consistent efficiency during the dynamic flow conditions. Improving particle retention results in more predictable fluid cleanliness levels and a system that can continually operate below the ISO cleanliness code limit.
Once the element has captured enough contaminant to reach approximately 90% of the terminal ΔP (dirty filter indicator setting), the main flow goes to zero and the injection system is turned off for a short dwell period. Then main flow goes to maximum element rated flow accompanied by real time particle count to measure retention efficiency of the contaminant loaded element. The dynamic duty cycle is repeated to further monitor the retention efficiency of the filter element after a restart.
Figure 7 shows the performance of an element that was subjected to the DFE restart test. During the restart, particle counts after the filter increased by a factor of 20 on the 6μ[c] channel, and the ISO Codes increased by 4 codes on the 4μ[c] and 6μ[c] channels. During the restart test, there is no contaminant being injected so any particles measured were released by the element or were already in the test loop. The temporary high contamination load in the fluid can pass through the sensitive components or bearings that the filter is charged with protecting if it can’t retain the dirt.
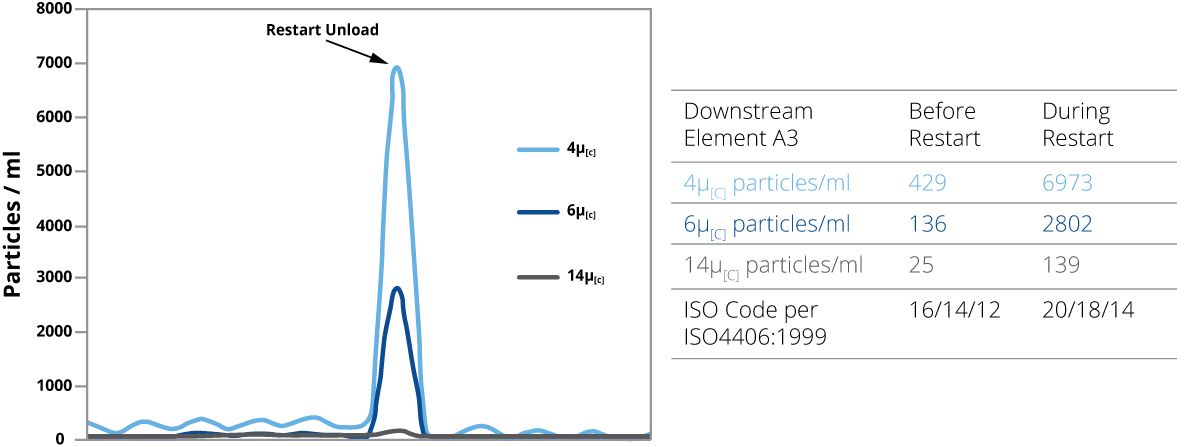
Figure 8 shows the performance of a Hy-Pro element. The unloading is evident in the DFE rated Hy-Pro element, but the effect is greatly reduced. The competitor element A3 (Figure 7) unloaded 84 times more particles 6μ[c] and larger than Hy-Pro, and 14 times more particles 4μ[c] and larger. The DFE rated Hy-Pro element had much higher retention efficiency than the filter designed and validated only to ISO16889 multi-pass.
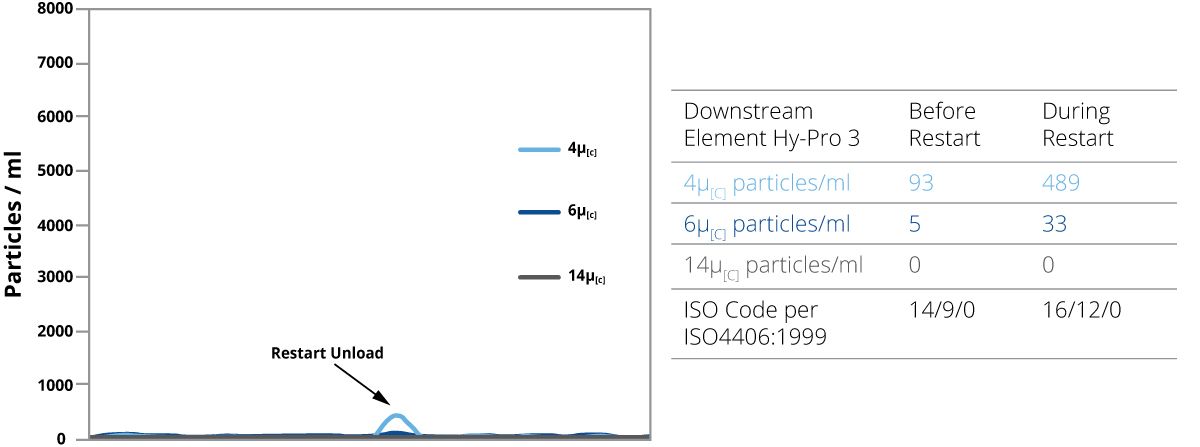
Figure 9 shows the performance of like elements produced by three different manufacturers that were tested to ISO 16889. The results were expressed as a time weighted beta ratio. Element B had a better capture efficiency than the Hy-Pro element in the constant flow test environment of ISO 16889. All of the elements tested were true to their Beta Ratio of β7[c] > 1000.
Time Weighted Beta Ratio Comparison for β7µ[C]>1000 Filter Element
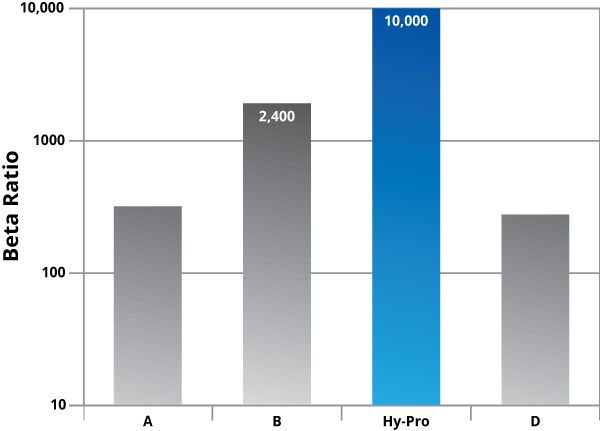
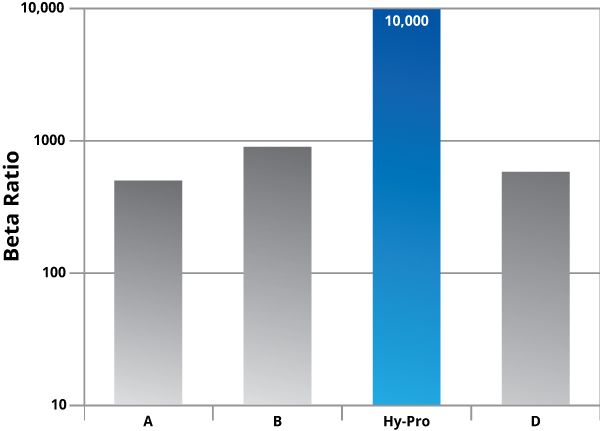
Figure 10 shows the time weighted performance of the like elements tested to DFE multi-pass to illustrate the performance differences between DFE and ISO16889.
Time Weighted Beta Ratio Comparison for β7µ[C]>1000 Filter Element
In Figure 11 the particle counts taken during flow change have been isolated to measure efficiency during dynamic flow. Since the DFE test has shown that filter element performance is at its worst during flow changes, isolating those sequences can help predict performance in dynamic conditions, and it is with this graph that we see how overall filter performance changes.
Beta Ratio Comparison per DFE Multi-Pass for β7µ[C]>1000 Filter Element
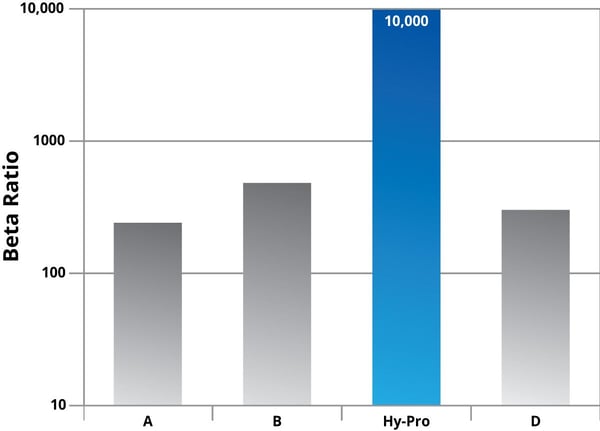
Element B had a beta ratio in excess of β7[c] > 2000 when tested to ISO16889 (Figure 9). However, Figure 11 shows the average beta ratio of Element B during variable flow to be β7[c] > 500. The Hy-Pro element beta ratio was in excess of β7[c] > 10,000, true to rating even in the dynamic test. The Hy-Pro performance in Figure 11 illustrates why Hy-Pro is committed to the DFE test method for design and development. DFE is Hy-Pro’s competitive advantage.
Relying solely on ISO16889 to predict how filter elements will perform in a dynamic system is like taking a boat into rough seas that has never been in the water. The current industry standard test for hydraulic and lube filter performance (ISO 16889) is a good tool for predicting performance of off-line filters and circulating systems, but it does not accurately represent the stress of a hydraulic circuit with dynamic flow conditions or a lube system cold start. Without DFE testing, it is difficult to truly predict actual filter performance in a dynamic system.